Electrical operating record
The captured view shows 289.8 kWh for the day, 16,026 kWh month-to-date and 99,081 kWh year-to-date. Each reading remains attached to this view and its recorded time.
 Get a quote ↗
MANUFACTURING · SOFTWARE · ENGINEERING
JIADEST combines transformer manufacturing with electrical inspection, field testing, monitoring systems and maintenance support. We help industrial and commercial customers understand asset condition, resolve electrical issues and develop a site-specific plan to manage energy costs.
CHINA IMPLEMENTATION · 27 OCT 2026
These recorded screens from a China customer implementation show how transformer monitoring and an energy management system (EMS) turn electrical measurements into an operating picture. JIADEST connects equipment supply, monitoring software and electrical operation and maintenance (O&M) support in one project scope.
Recorded project snapshots, not a live connection. English labels and anonymized site names are presentation layers; original readings, available upper-chart traces and timestamps are retained. The energy view includes a completed report summary compiled from visible readings. Readouts belong to their displayed view and time, rather than a single synchronized report.
SUBSTATION REPORT · EQUIPMENT, STATUS & RESPONSE
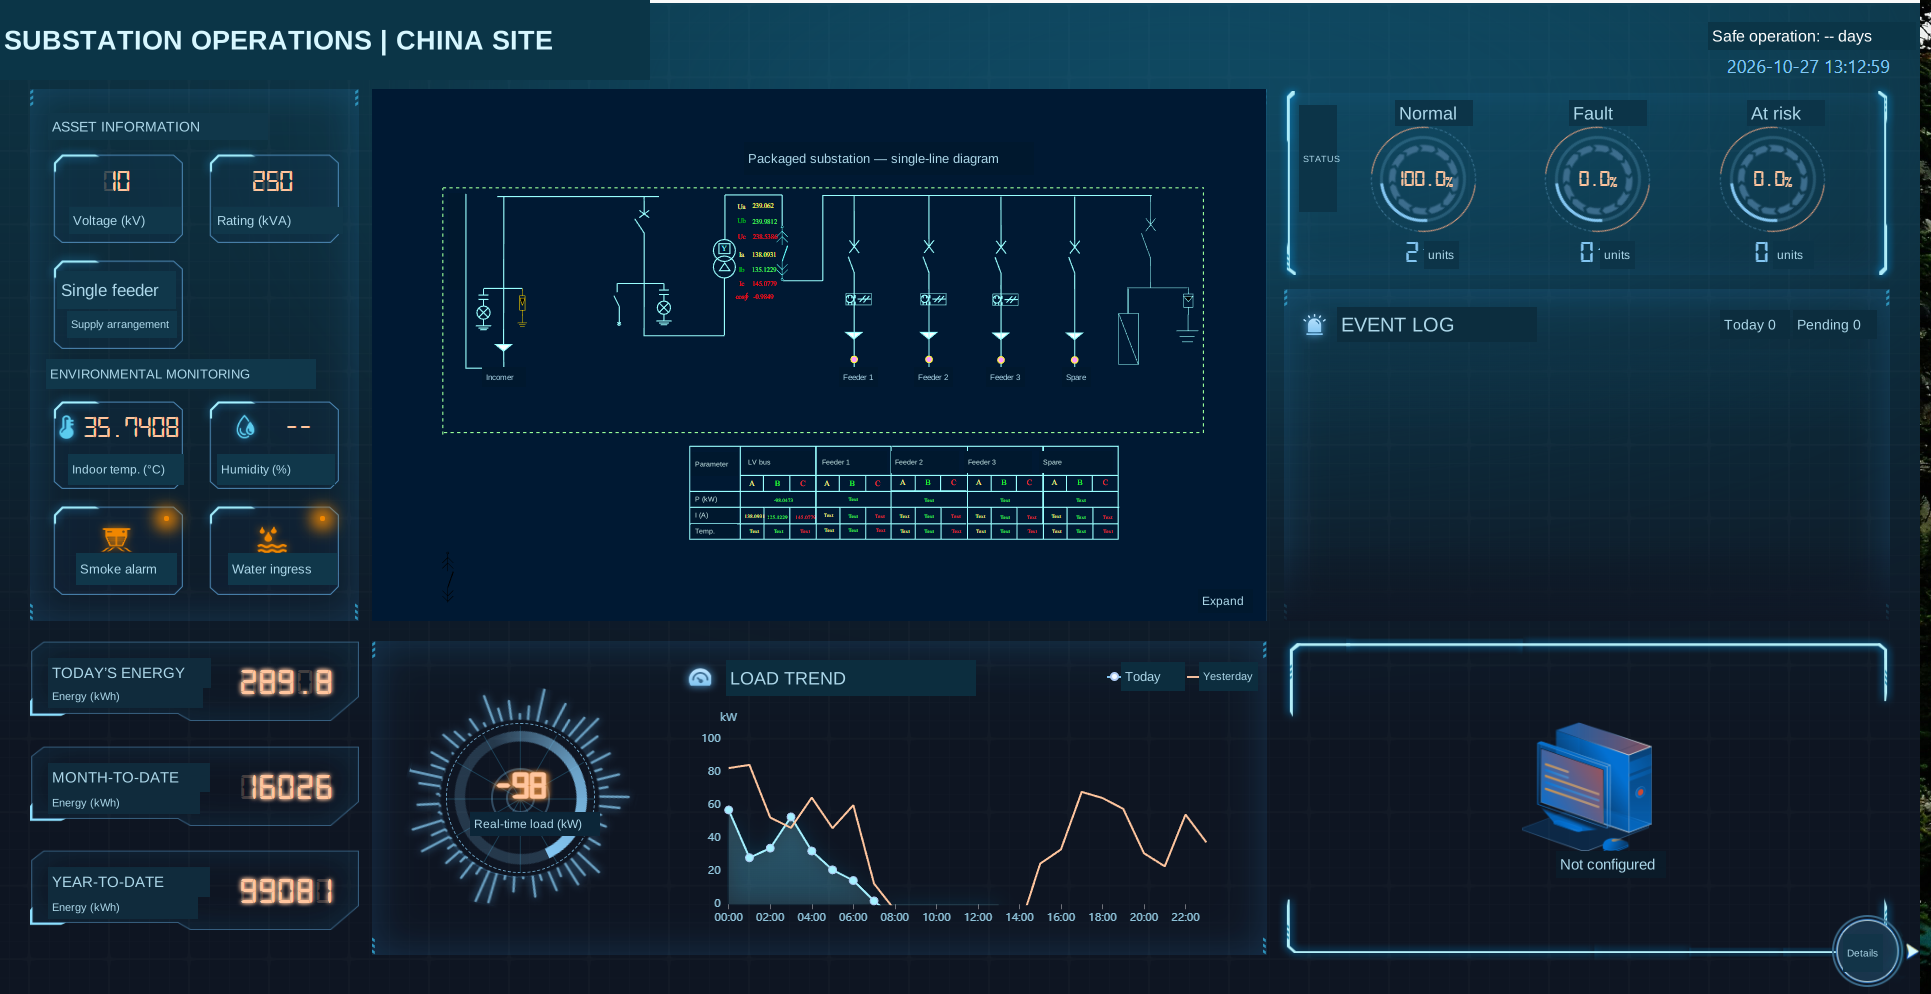
The single-line view records a 10 kV supply and a 250 kVA transformer alongside feeder information, equipment status, environmental monitoring and load trends. This gives operators and engineers a shared reference for discussing the installation.
The captured view shows 289.8 kWh for the day, 16,026 kWh month-to-date and 99,081 kWh year-to-date. Each reading remains attached to this view and its recorded time.
The screen marks two assets as normal, with zero faults, zero at-risk assets and zero events for the day. These are recorded platform indications for that snapshot, rather than a guarantee of future equipment condition.
Engineers review operating changes against the single-line diagram, asset ratings and site conditions. Where inspection or testing is needed, the agreed service scope connects the finding to a documented maintenance action.
An English asset and monitoring-point schedule, the agreed single-line view, status and event records, inspection findings and a maintenance action list with responsibilities and follow-up items. Reporting frequency, measurement availability and field-service responsibilities are agreed for your project.
Bring transformer ratings, feeder information and operating measurements into a clear single-line view. Review changing conditions and decide where a closer inspection is needed.
Keep event status alongside equipment data. Engineers can review the record, verify the condition and agree the inspection, test or corrective work required.
ENERGY REPORT · READINGS, REVIEW & ACTION
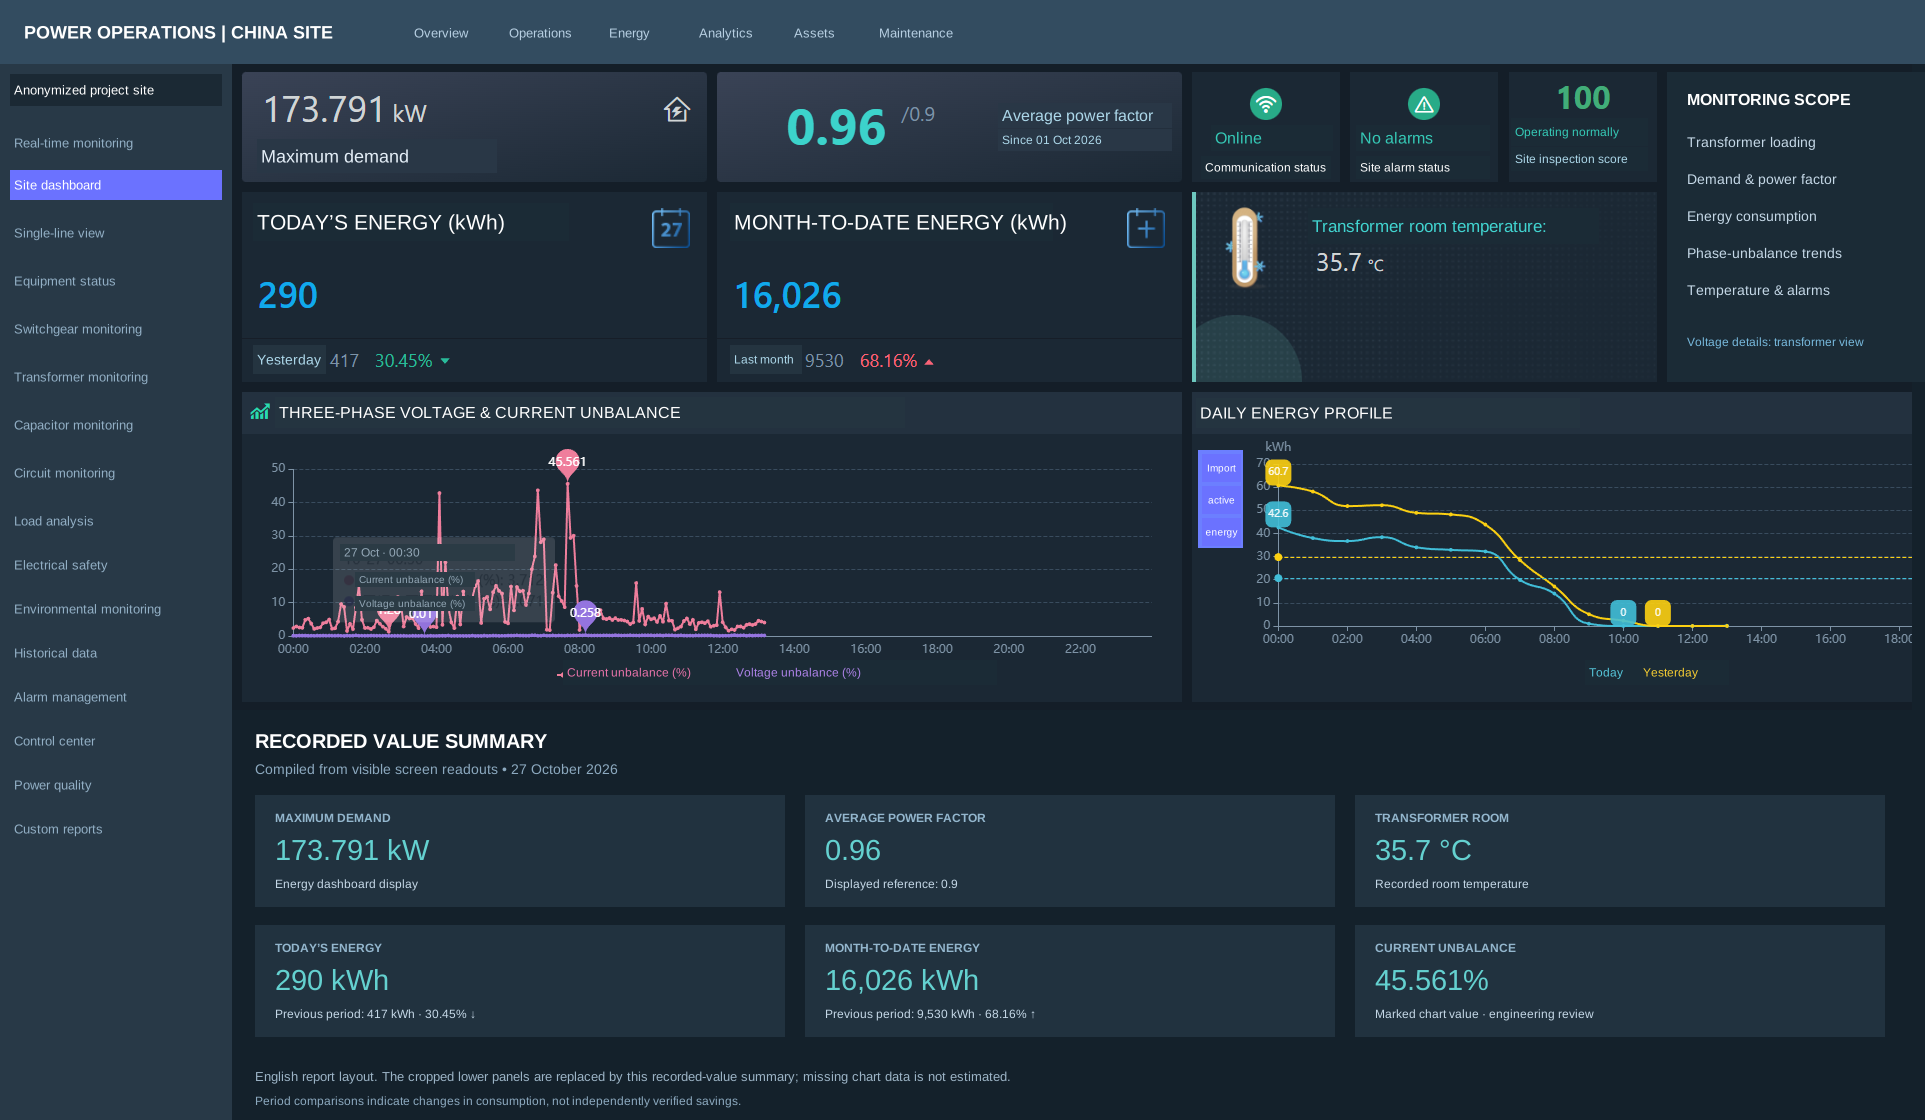
The report brings electricity demand, power factor, consumption and temperature into one review. It helps the operations team decide which changes need investigation and what evidence is needed before choosing an improvement measure.
| Recorded indicator | Visible value | What we review with your team |
|---|---|---|
| Maximum demand | 173.791 kW | Relate demand peaks to the production schedule and the applicable utility tariff. |
| Average power factor | 0.96 · displayed reference 0.9 | Review reactive power requirements, compensation equipment and utility billing conditions. |
| Daily energy comparison | 290 / 417 kWh · 30.45% decrease | Check the comparison interval, production output and operating hours before attributing the change. |
| Month-to-date comparison | 16,026 / 9,530 kWh · 68.16% increase | Investigate changes in utilization and demand; establish an appropriate energy baseline. |
| Room temperature / current unbalance | 35.7 °C / 45.561% marked value | Review environmental conditions and phase loading, then verify measurements before selecting corrective work. |
An English monitoring report with the reporting period, measurement units, demand and consumption trends, power-factor review, items requiring verification and prioritized improvement recommendations. Site-specific savings are evaluated against an agreed baseline. Reporting frequency, measurement availability and field-service responsibilities are agreed for your project.
The daily comparison is 290 kWh versus 417 kWh, with a displayed change of −30.45%. Month-to-date energy is 16,026 kWh versus 9,530 kWh, a displayed increase of 68.16%. These comparisons guide investigation; they are not verified savings from an efficiency measure.
The current-unbalance chart includes a 45.561% marker. Review phase loading, operating schedules and measurement configuration before selecting corrective measures. The dashboard alone does not establish a fault diagnosis or compliance result.
| Parameter | Recorded value | Engineering context |
|---|---|---|
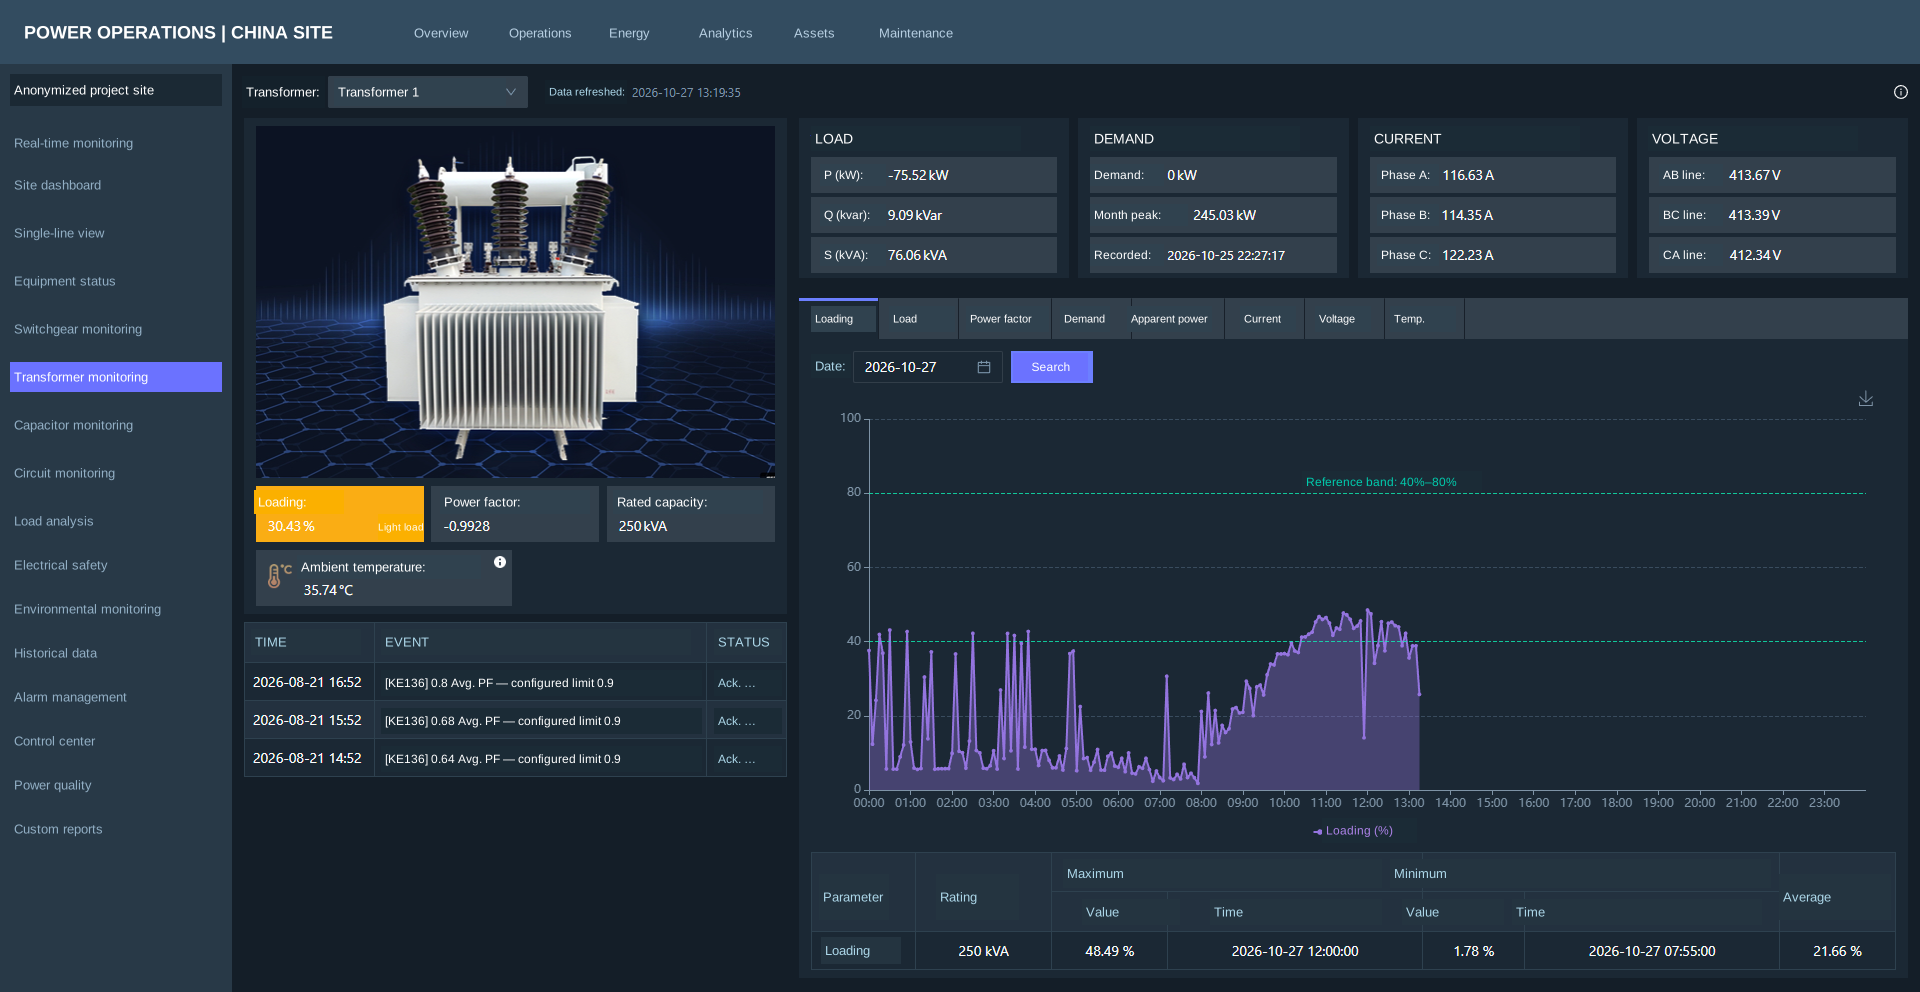
| Phase current, A / B / C | 116.63 / 114.35 / 122.23 A | Review phase loading and changes over time. |
| Line voltage, AB / BC / CA | 413.67 / 413.39 / 412.34 V | Retain line-to-line voltage labels and units. |
| Active / reactive / apparent power | −75.52 kW / 9.09 kvar / 76.06 kVA | Signed power requires the meter’s import/export convention. |
| Power factor | −0.9928 | Verify power-flow direction and CT polarity before interpreting the sign. |
| Monthly peak demand | 245.03 kW | This transformer view’s demand value is separate from the energy dashboard’s 173.791 kW display. |
FROM IMPLEMENTATION DATA TO YOUR PROJECT
Start with your transformer nameplates, single-line diagram, meter list, electricity bills and operating priorities. We can develop the measurement scope, English monitoring views, reporting requirements and maintenance plan around your facility.
Remote engineering review can connect your site information with specialist support where the agreed communications and access arrangements permit. Voltage, frequency, data interfaces, local tariff rules, commissioning and regional on-site responsibilities are reviewed for each project.
Request a monitoring & energy assessment ↗FIELD SERVICE CAPABILITIES
Our electrical service portfolio connects inspection, testing and maintenance with the needs of operating facilities. These field photographs show the work covered by the portfolio, alongside the technical outputs that can be agreed for your project.
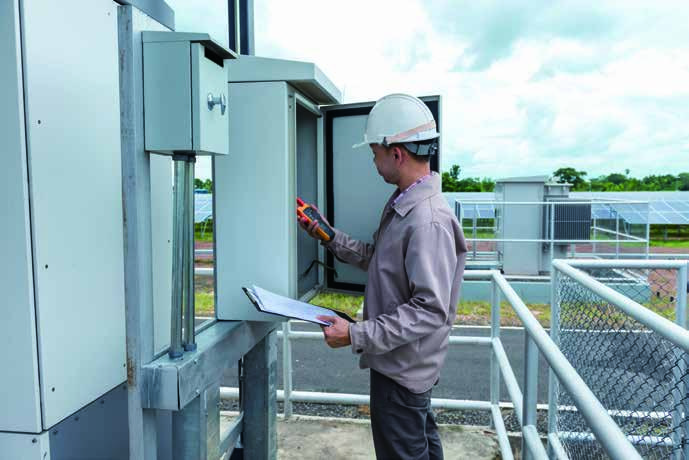
Inspect electrical assets, assess operating condition and identify defects that need attention. Agree a prioritized maintenance plan around the equipment and the site operating schedule.
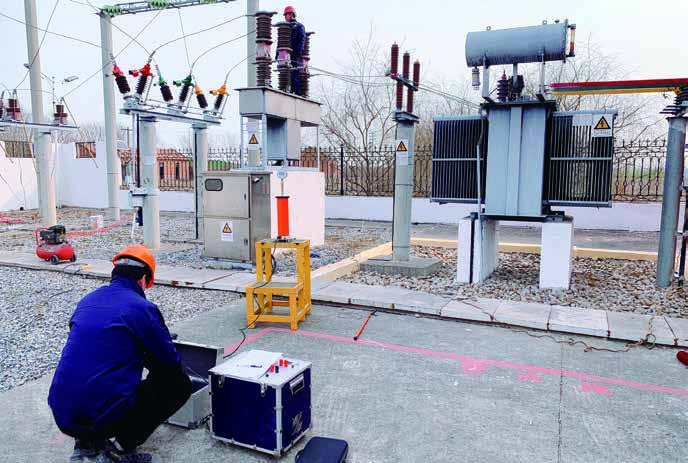
Carry out the agreed electrical tests on transformers, instrument transformers and switchgear. The service scope can include insulation resistance, winding resistance, turns ratio and other asset-specific tests.
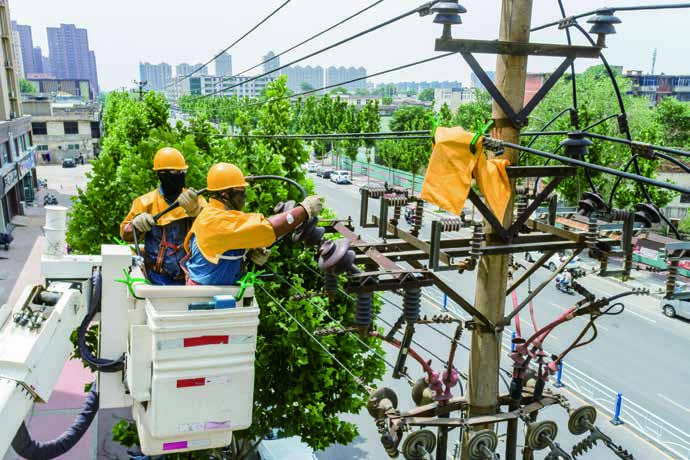
Plan inspections, defect rectification and maintenance for overhead lines, cables and associated distribution equipment. Coordinate site access, work scope and any required outage arrangements before the work.
WHAT YOUR TEAM CAN RECEIVE
A service engagement starts with your equipment and operating priorities. We agree the measurement points, inspection or test scope, reporting requirements and engineering support before work begins.
Request a tailored service scope ↗Document equipment condition, observed defects and the items requiring follow-up.
Record the measurements and results for the agreed tests, with engineering assessment for the equipment under review.
Review load patterns, electricity tariffs, transformer utilization and reactive power compensation to identify suitable measures.
Define the work priorities, responsibilities and service arrangements for inspection, defect rectification and ongoing support.
INTEGRATED CAPABILITY
A coordinated architecture brings physical equipment and digital oversight into the same operating strategy, from the transformer and distribution panel to the monitoring desk and maintenance team.
Temperature sensors, metering and distribution terminals collect the operating information that matters. Transformer, switchgear, busbar and cable measurements form the foundation for a practical monitoring system.
Turn field measurements into a clear operating picture. Computer-based visualization, load analysis and abnormal-condition alerts help your team understand what is happening and where attention is needed.
Connect the alarm to an engineering response. Inspection, electrical testing, fault assessment and planned maintenance turn monitoring information into work that supports safe, reliable operation.
REMOTE MONITORING & CONDITION VISIBILITY
Keep transformer temperature, busbar and cable temperatures, current, load and video information within a computer-based monitoring environment. Abnormal-condition alerts help the responsible team investigate changes before they become more disruptive.
Measurement points, data availability and control functions are engineered around the connected equipment. Where approved, field devices and distribution automation can support coordinated remote operations.
Alarm configuration example
Cable temperature > 80 °C triggers an alert in the service concept. Actual setpoints and responses are defined for the equipment, operating conditions and protection strategy.
Sensors · Meters · Distribution terminals
Equipment visibility · Load analysis · Alerts
Verify condition · Prioritize work · Plan response
Inspect · Test · Maintain · Review
ENERGY COST OPTIMIZATION
Higher electricity costs can come from when power is used, how equipment is loaded and how reactive power is managed. We combine operating information with engineering assessment to identify measures suited to your facility.
Review operating schedules against peak and off-peak electricity tariffs. Identify loads that can be shifted without compromising production requirements.
Assess lightly loaded and idle equipment. Develop operating plans for transformer utilization and unnecessary energized capacity.
Assess reactive power compensation, capacitor-bank condition, harmonics and phase imbalance. Correct the causes of poor compensation and review applicable utility penalties.
Evaluate energy storage, photovoltaic generation and EV charging alongside the facility load profile, grid connection and operating requirements.
Savings depend on the existing installation, operating profile, local tariff and implemented measures. Establish the baseline and evaluate results for your site; a fixed saving percentage is not assumed.
ELECTRICAL ENGINEERING & LIFECYCLE SERVICES
From planning and installation to electrical diagnostics and ongoing maintenance, our service approach connects technical decisions with the operating needs of industrial, commercial, utility and new-energy facilities.

Electrical condition and demand assessment, transformer capacity selection, switchgear selection, protection settings, substation layouts and supply-capacity changes. Engineering scope includes transmission and substation projects at 110 kV and below, subject to project requirements and local approvals.
Operation and maintenance of master stations, communications, distribution terminals and primary equipment. Support for RTU, DTU, FTU and TTU installations, feeder automation functions, remote measurement, signaling and control accuracy.
Infrared thermography, partial-discharge detection, power quality assessment and surge-arrester resistive-current testing help identify developing problems while equipment is in service, where the approved method and site conditions permit.
Testing for power transformers, CTs and VTs, switchgear, capacitors, surge arresters and reactors. Scope can include withstand voltage, insulation resistance, winding resistance, transformer turns ratio, breaker timing, contact resistance, leakage current, capacitance and inductance tests.
Routine inspection, scheduled servicing, defect rectification, cable and transformer fault assessment, emergency repair coordination and incident analysis. Remote escalation and field-response arrangements are defined by the service agreement and site coverage.
Video surveillance, access control, intrusion detection, perimeter alarms and SF₆ gas detection. Engineering and lifecycle support can also cover photovoltaic grid connection, energy storage and EV charging installations.
PROJECT DELIVERY
Review the single-line diagram, transformer ratings, asset condition, load requirements, utility bills and the operating constraints.
Define sensors, measurement points, terminal equipment, communications, software views, alarm thresholds and project responsibilities.
Coordinate equipment supply, installation, testing and commissioning. Verify measurements and alarm functions against the agreed scope.
Review operating information, prioritize maintenance, implement agreed energy measures and evaluate results against the baseline.
For international projects, define the voltage and frequency, local grid requirements, metering and communication interfaces, tariff structure and regional service coverage during technical review. Remote support, commissioning responsibilities and on-site service commitments are agreed for each project.
TRANSFORMER MONITORING & ELECTRICAL O&M
Depending on installed meters and sensors, a transformer monitoring system can display phase currents, line and phase voltages, active, reactive and apparent power, power factor, demand, loading and temperature. The China implementation shown here includes a 250 kVA transformer, a single-line overview, historical load profiles and energy-use dashboards.
Monitoring helps identify demand peaks, lightly loaded transformers, reactive power issues and changes in electricity use. JIADEST reviews these findings with your tariff and production schedule to develop suitable actions. A lower kWh reading alone does not establish verified energy savings; results need a comparable baseline and measurement period.
We review international projects around supply voltage and frequency, metering, communications, access permissions, local grid requirements and service coverage. Remote engineering support, data reporting, commissioning and local on-site responsibilities are defined in the project scope.
The agreed scope can include measurement-point schedules, English dashboard views, historical trend reviews, alarm and event records, energy-use analysis and a prioritized maintenance action plan. Inspection and electrical test records are provided where those services are included.
TALK TO JIADEST
Share your country, single-line diagram, transformer nameplates, load profile, electricity bills and monitoring requirements. We can review the equipment, software and service scope together.